
Tableau Desktop

Quick access to information from Tableau Desktop
Discover the power of data analysis with Tableau Desktop. With easy creation of interactive visualizations and advanced data processing tools, Tableau Desktop enables you to quickly explore and analyze complex data sets to help you make smart business decisions. Let Tableau Desktop lead you on a journey to discover valuable insights and trends.
Create advanced analytics in Tableau Desktop.
Connect to data locally and in the cloud
Connect to data locally or in the cloud - whether it's large datasets, an SQL database, a spreadsheet or cloud applications such as Google Analytics and Salesforce. Access and combine disparate data without writing code. Plus, with advanced features, transform data to suit your needs.
Quickly find information
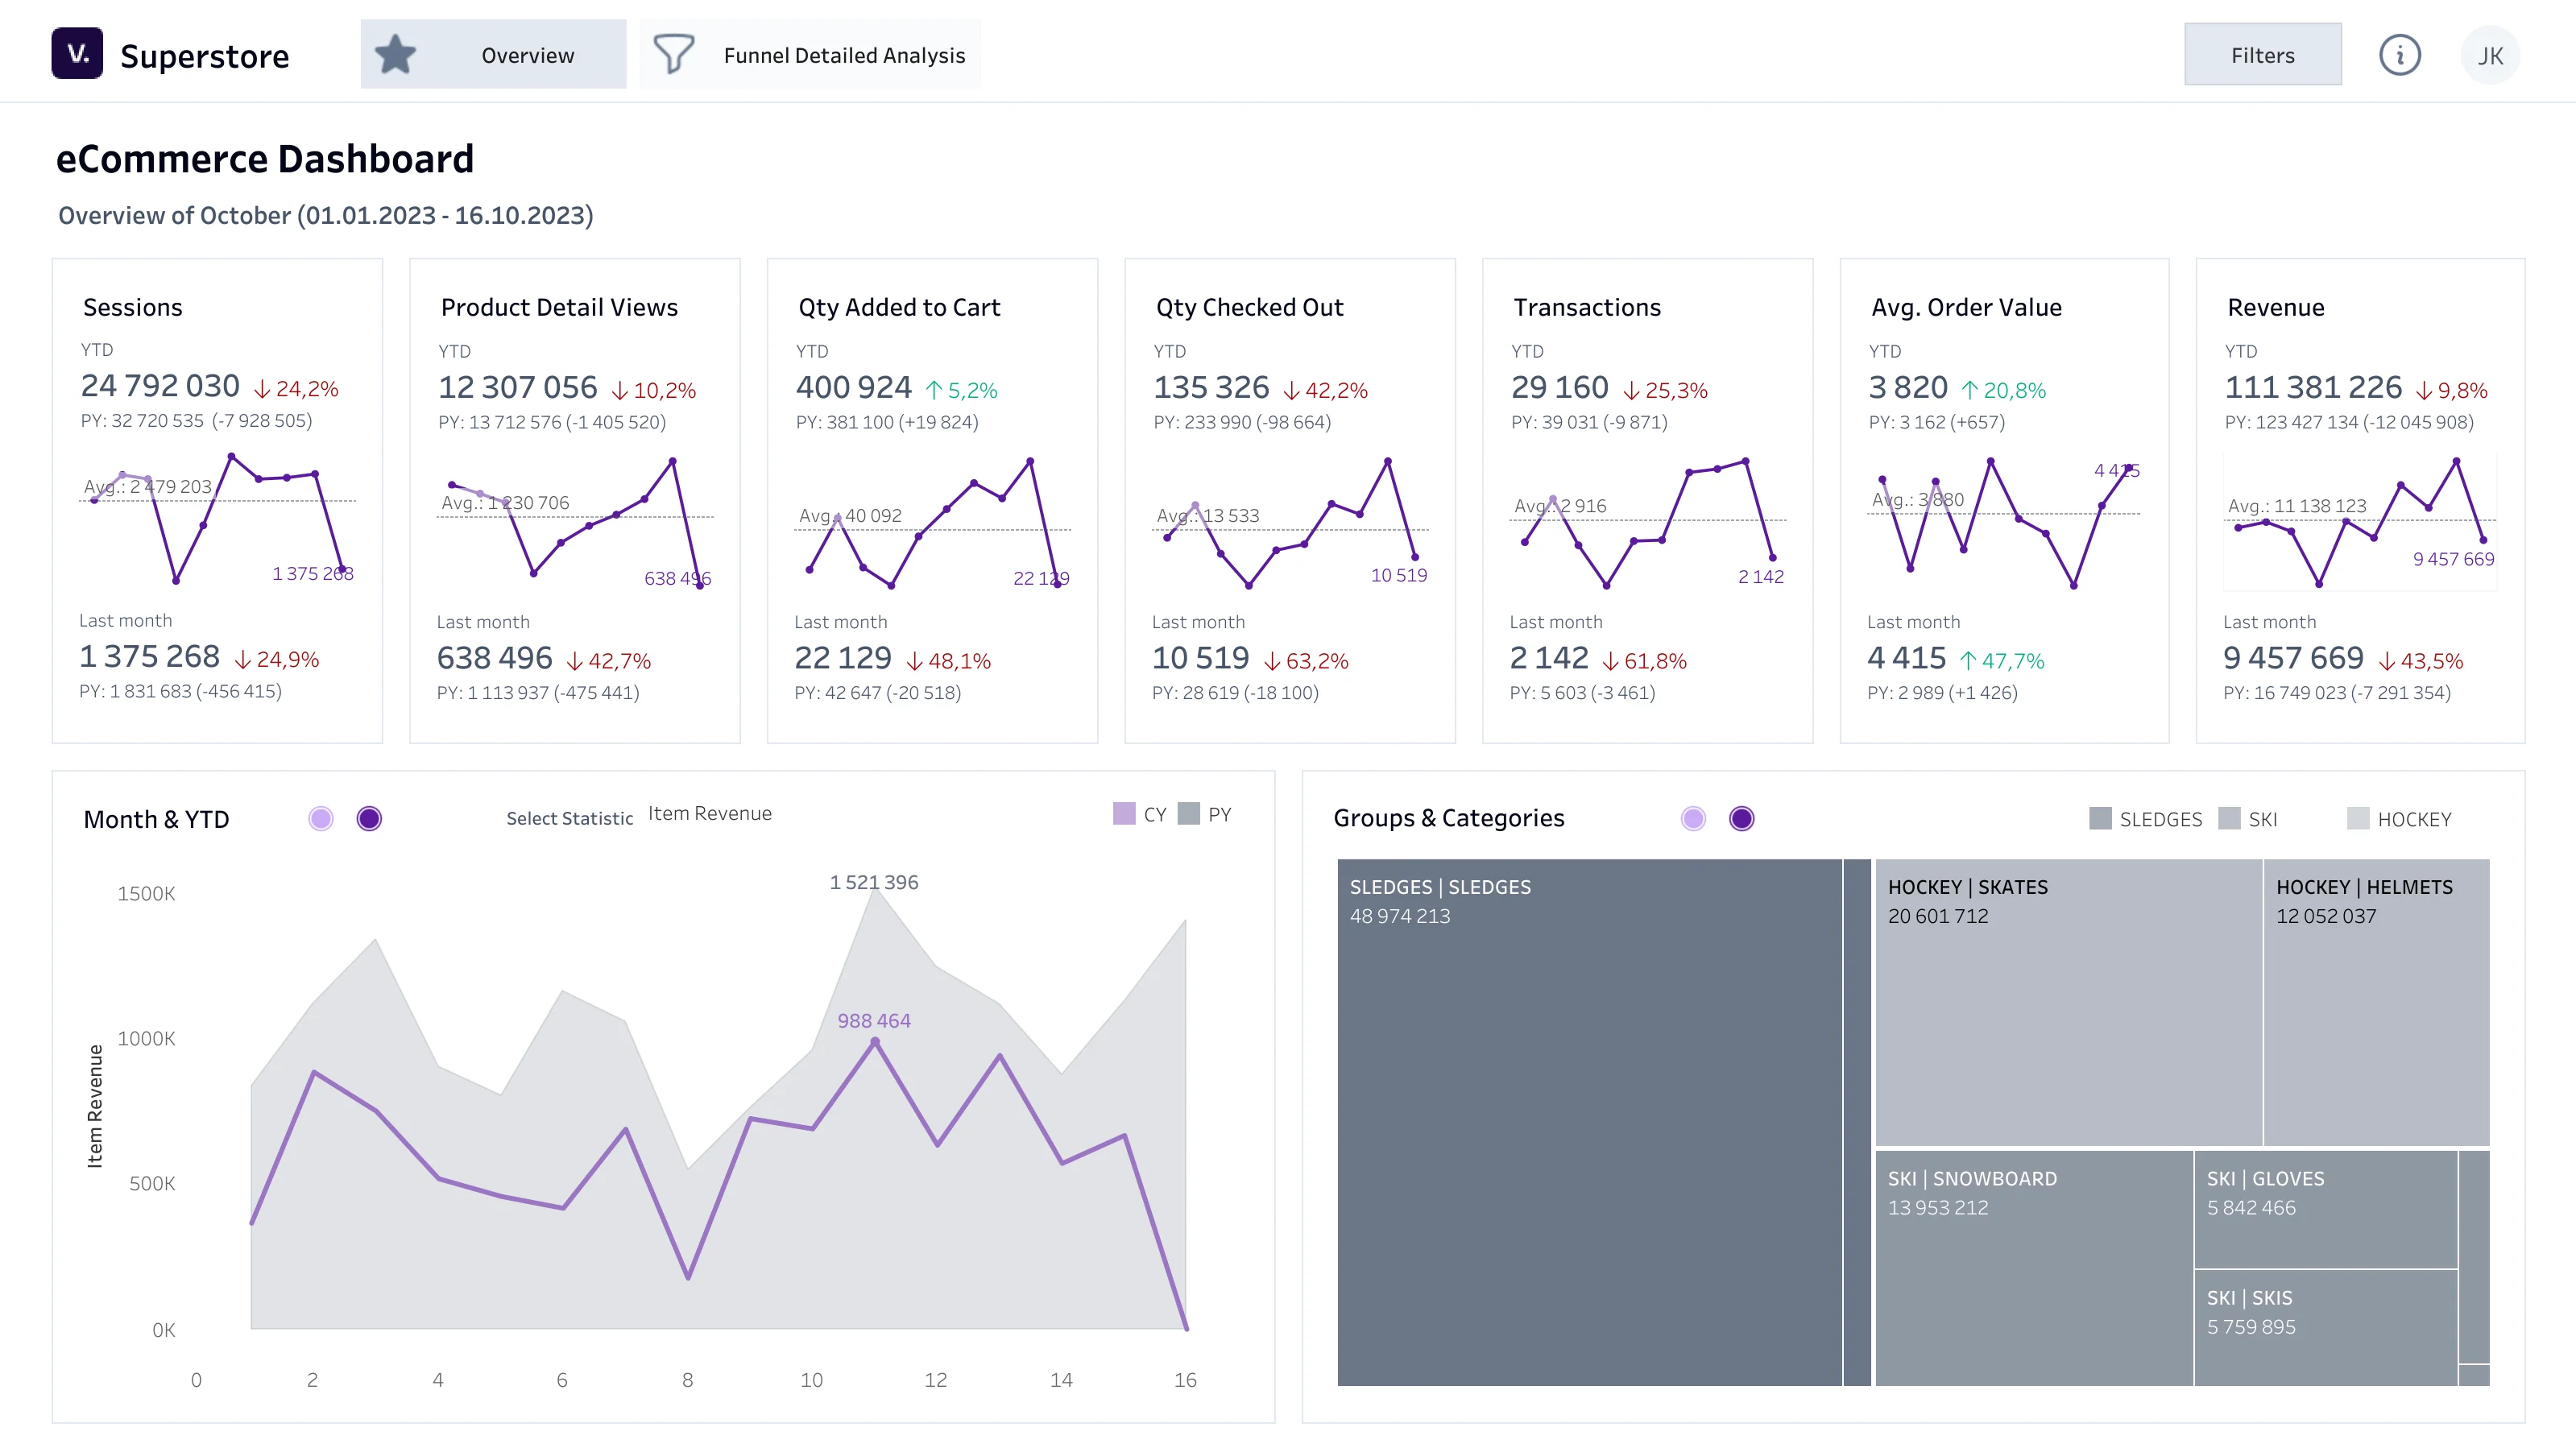
Tableau's visual analytics enable unlimited data exploration. Interactive dashboards help you discover hidden information instantly. Tableau takes advantage of people's natural ability to see visual patterns quickly, so you'll notice the most important things in no time.
Exploration of the answer
Exceptional analysis requires more than just a nice dashboard. Quickly create advanced calculations from existing data, reference lines or forecasts based on historical data. Ask new questions, spot trends, identify opportunities and make data-driven decisions with confidence.
Advanced analytical capabilities.
Tableau Desktop offers a rich set of analytic features that allow users to transform data into detailed and complex analysis and charts, which is crucial for a deep understanding of trends and patterns.

Data integration
With the ability to connect to virtually any data source, locally or in the cloud, Tableau Desktop enables easy and fast integration, which is essential for today's organizations flooded with data from a variety of sources.
Interactive dashboards and visualizations
The developed visualizations and dashboards can be easily made interactive, allowing end users to explore the data by filtering, sorting and transforming the presented visual data.

WhyTableau Desktop?
Data analysis without programming knowledge
The ability to create complex data analytics without having to write complicated code opens the door to advanced analytics for business users, without a technical background.
Intuitive transformation of data into knowledge
Tableau Desktop allows you to easily turn raw data into deep visual analytics, making it easier for users to make smart, data-driven decisions.
Ease of sharing and collaboration
The visualizations and dashboards you create can be shared with others through Tableau Server or Tableau Cloud, promoting collaboration and communication across your organization.
See how it works— dashboards live.
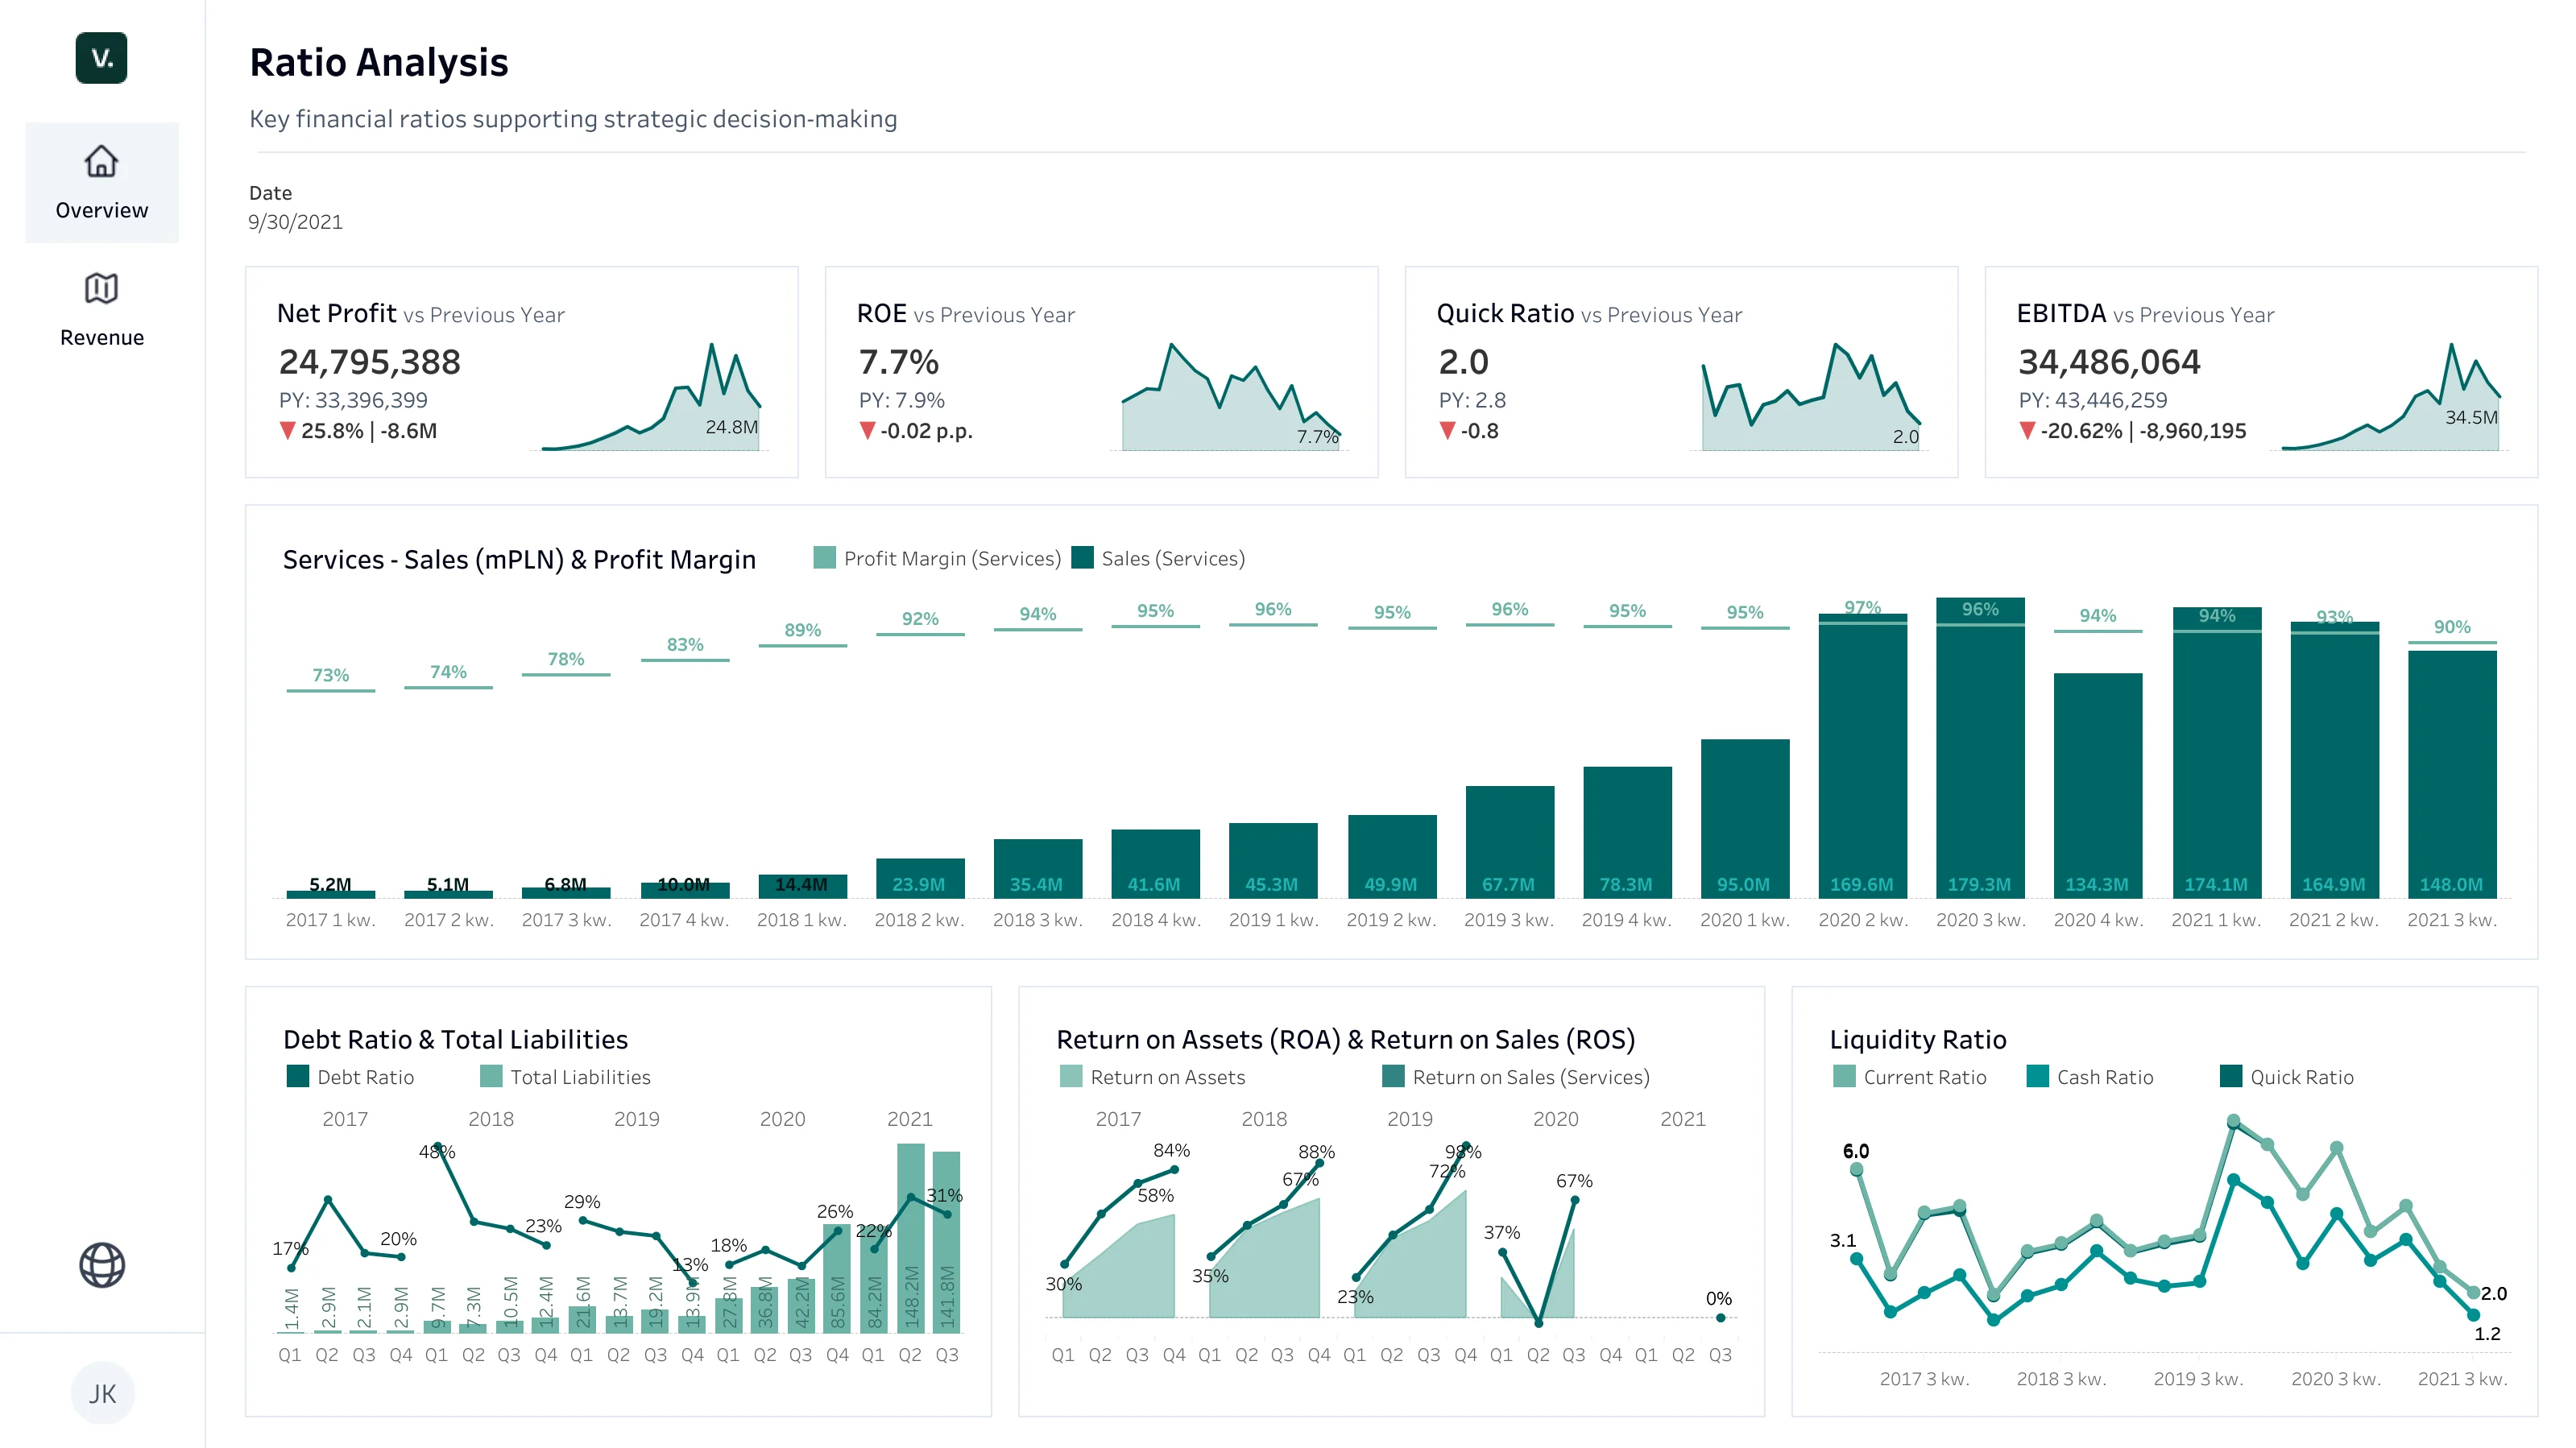
Financial Dashboard
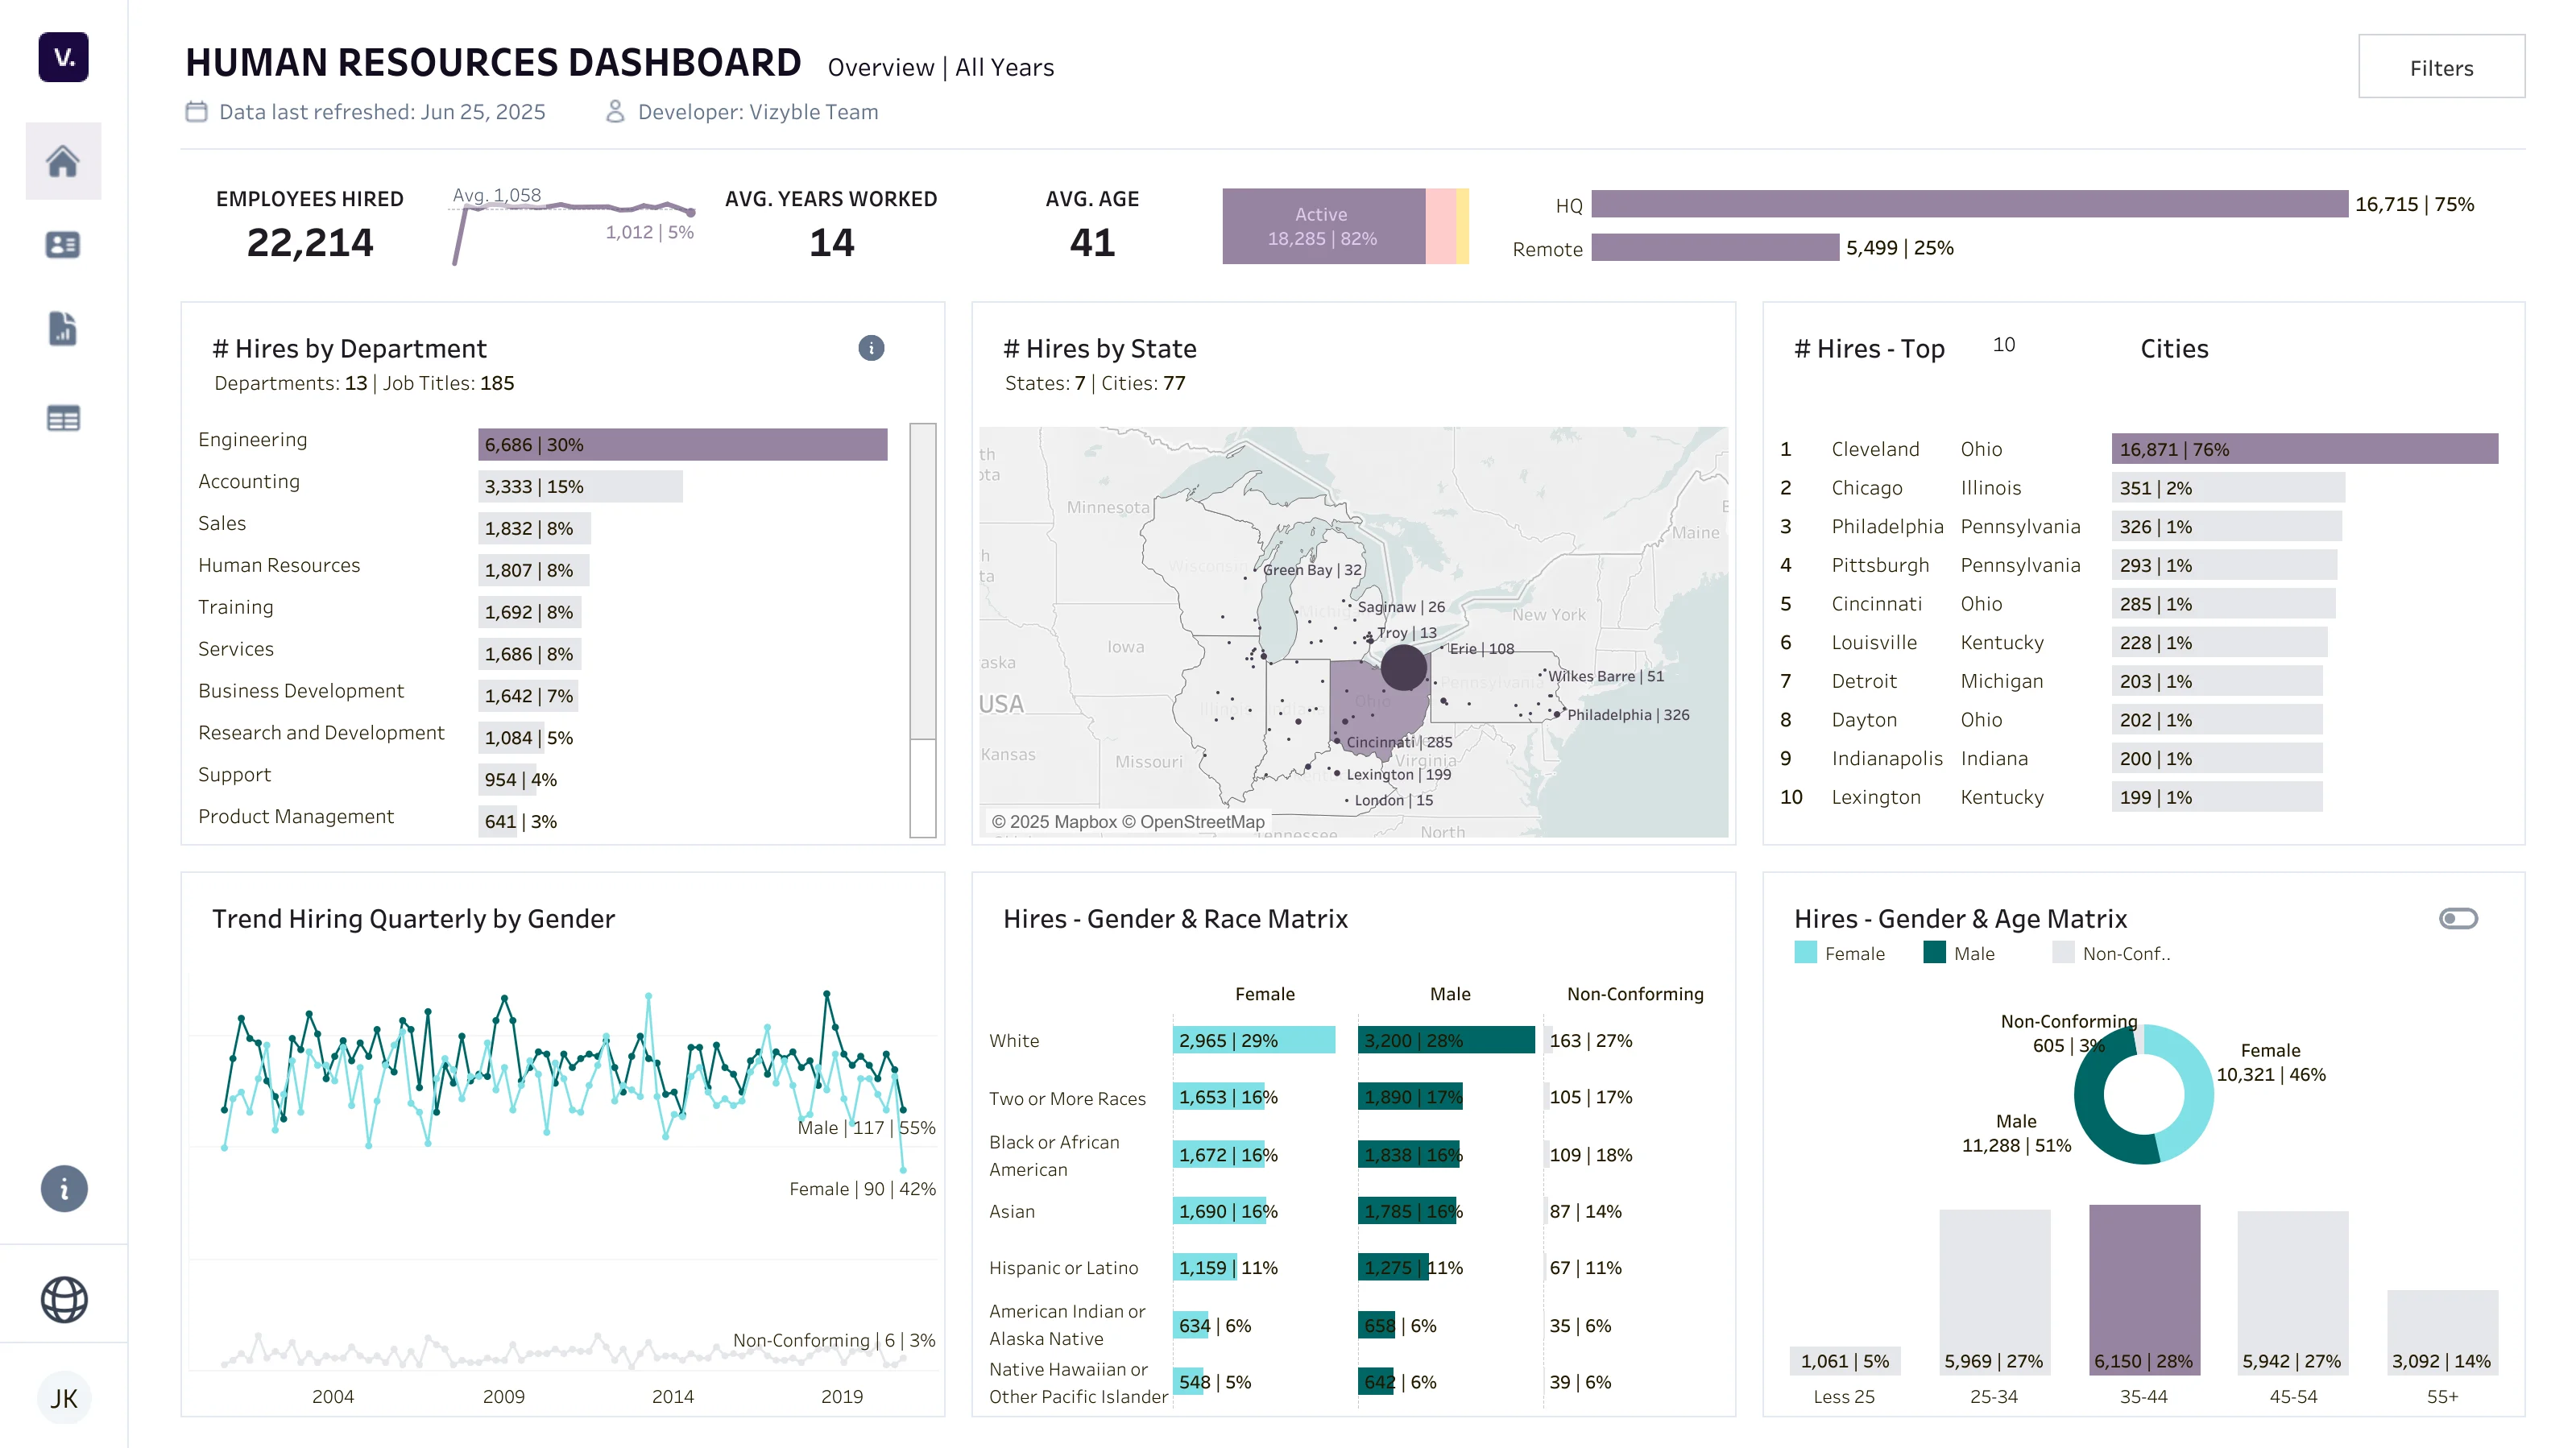
Dashboard for HR
Dashboard for Manufacturing Company

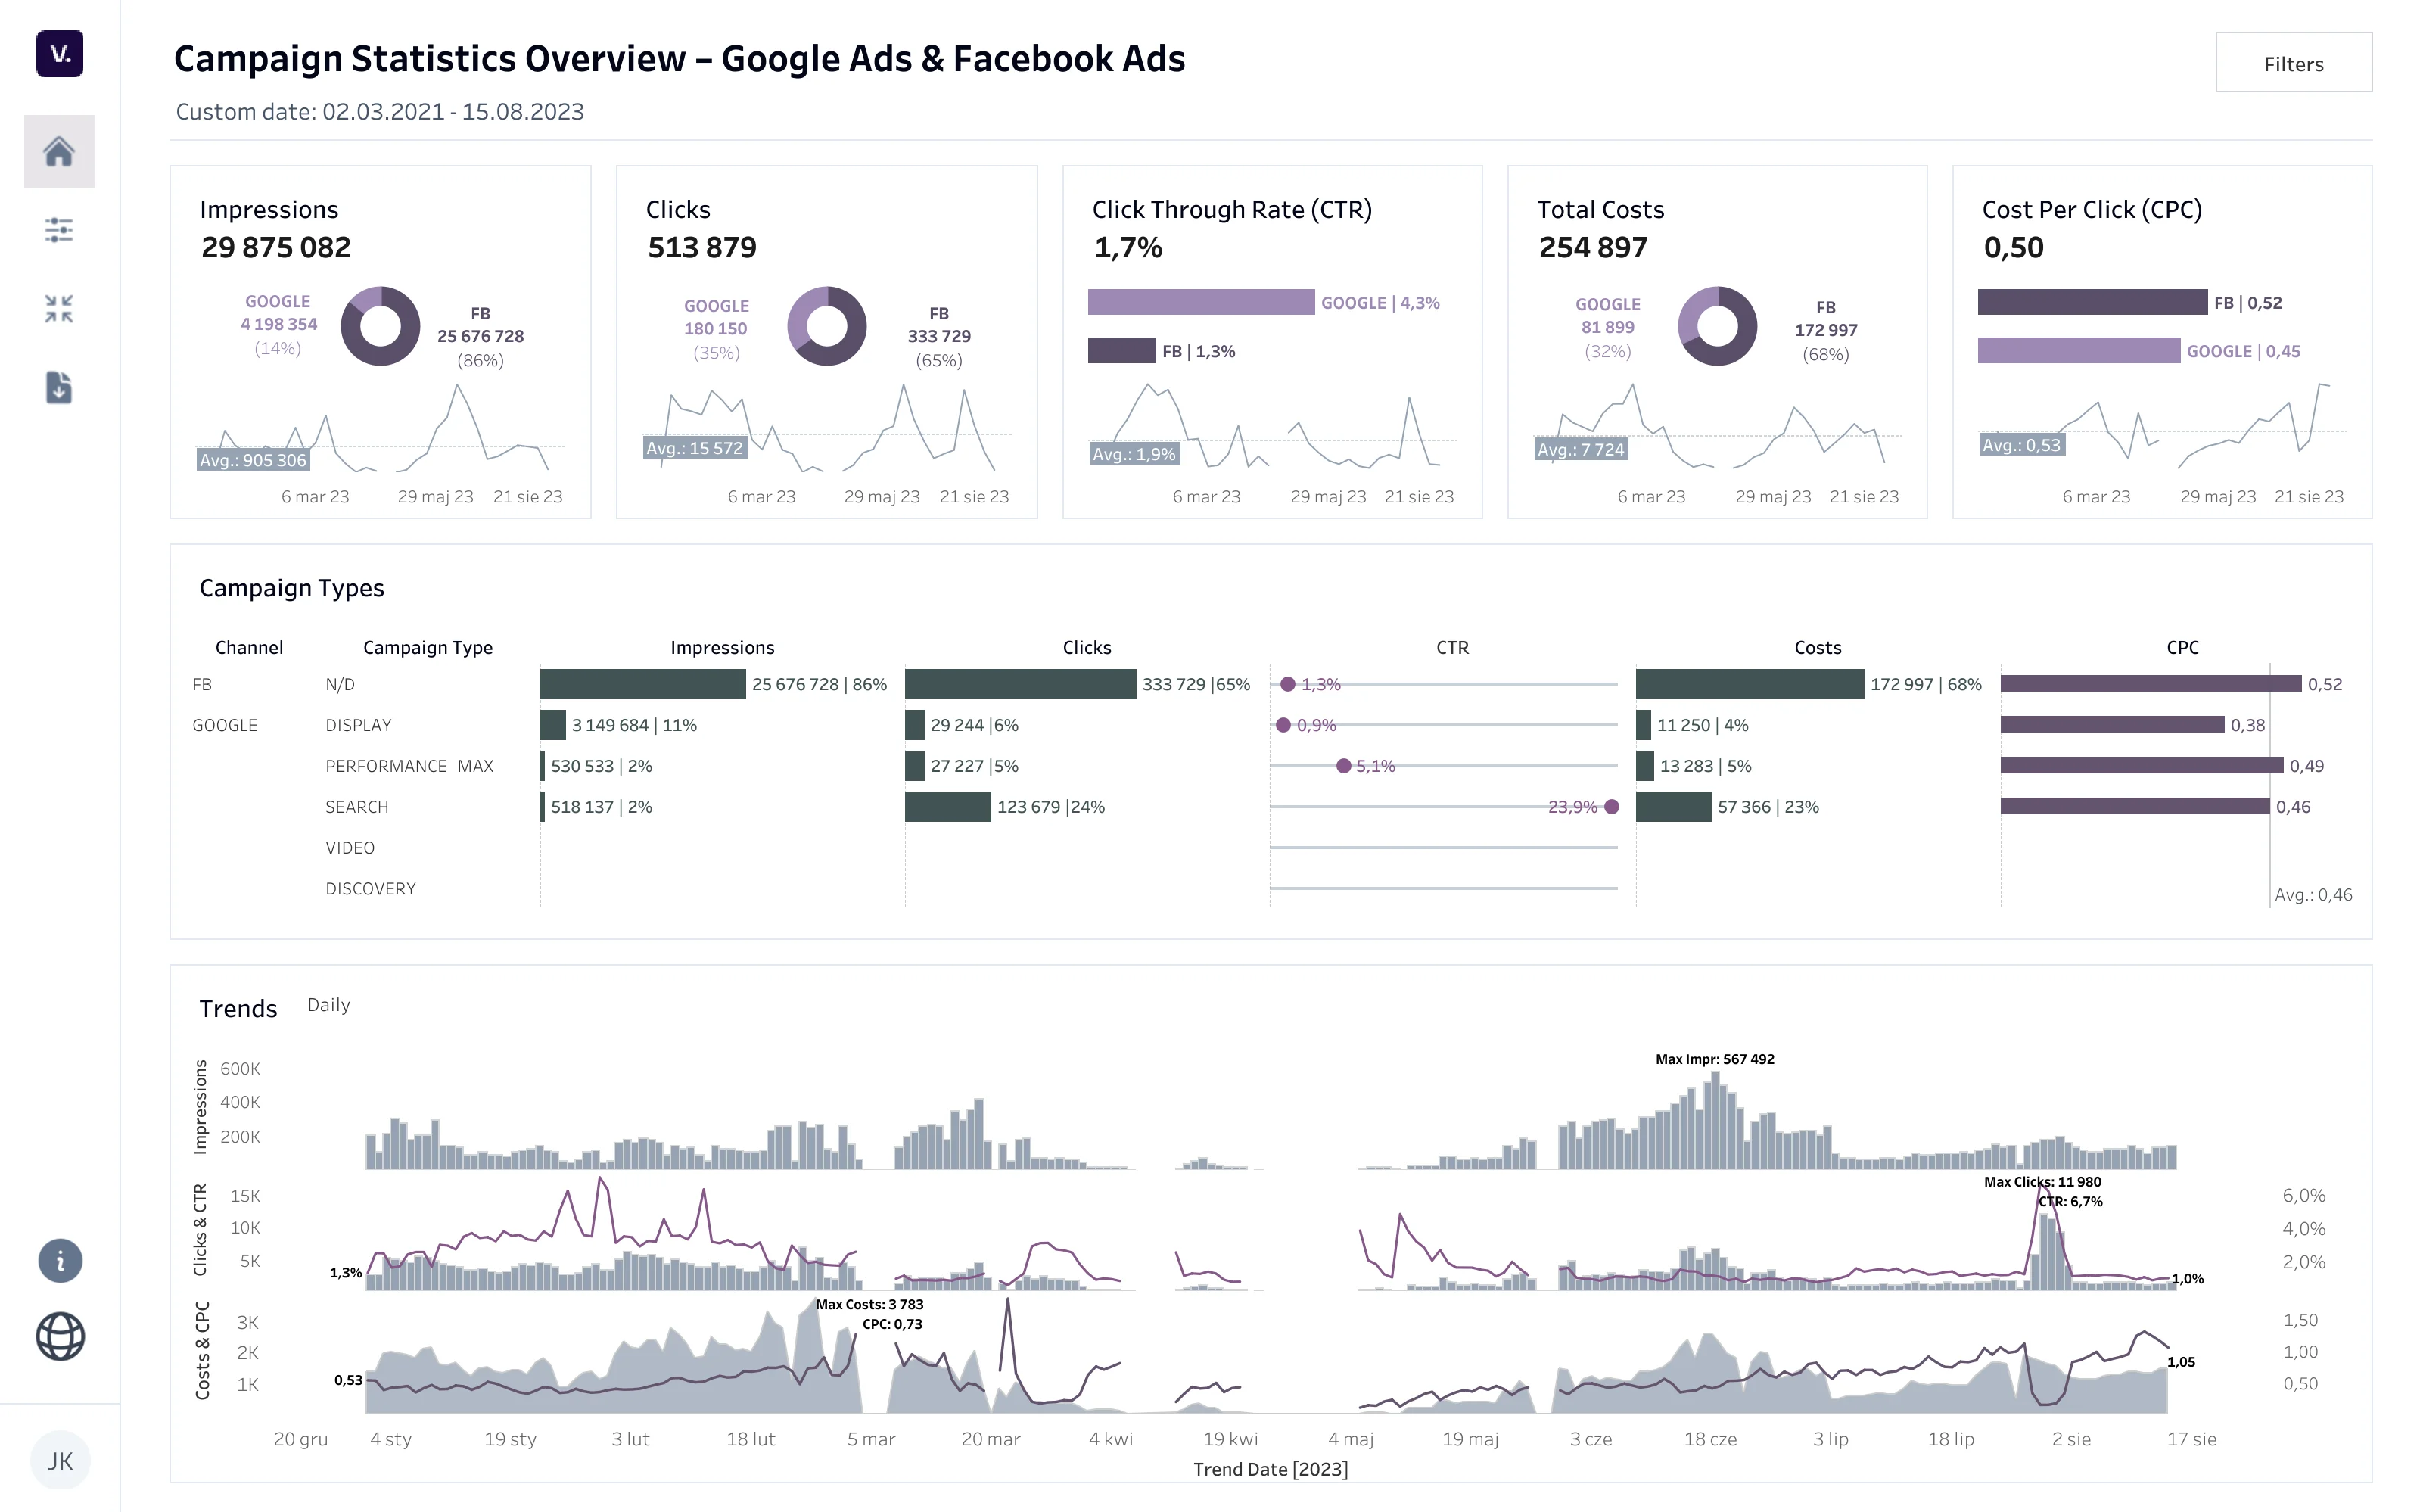
Marketing Dashboard
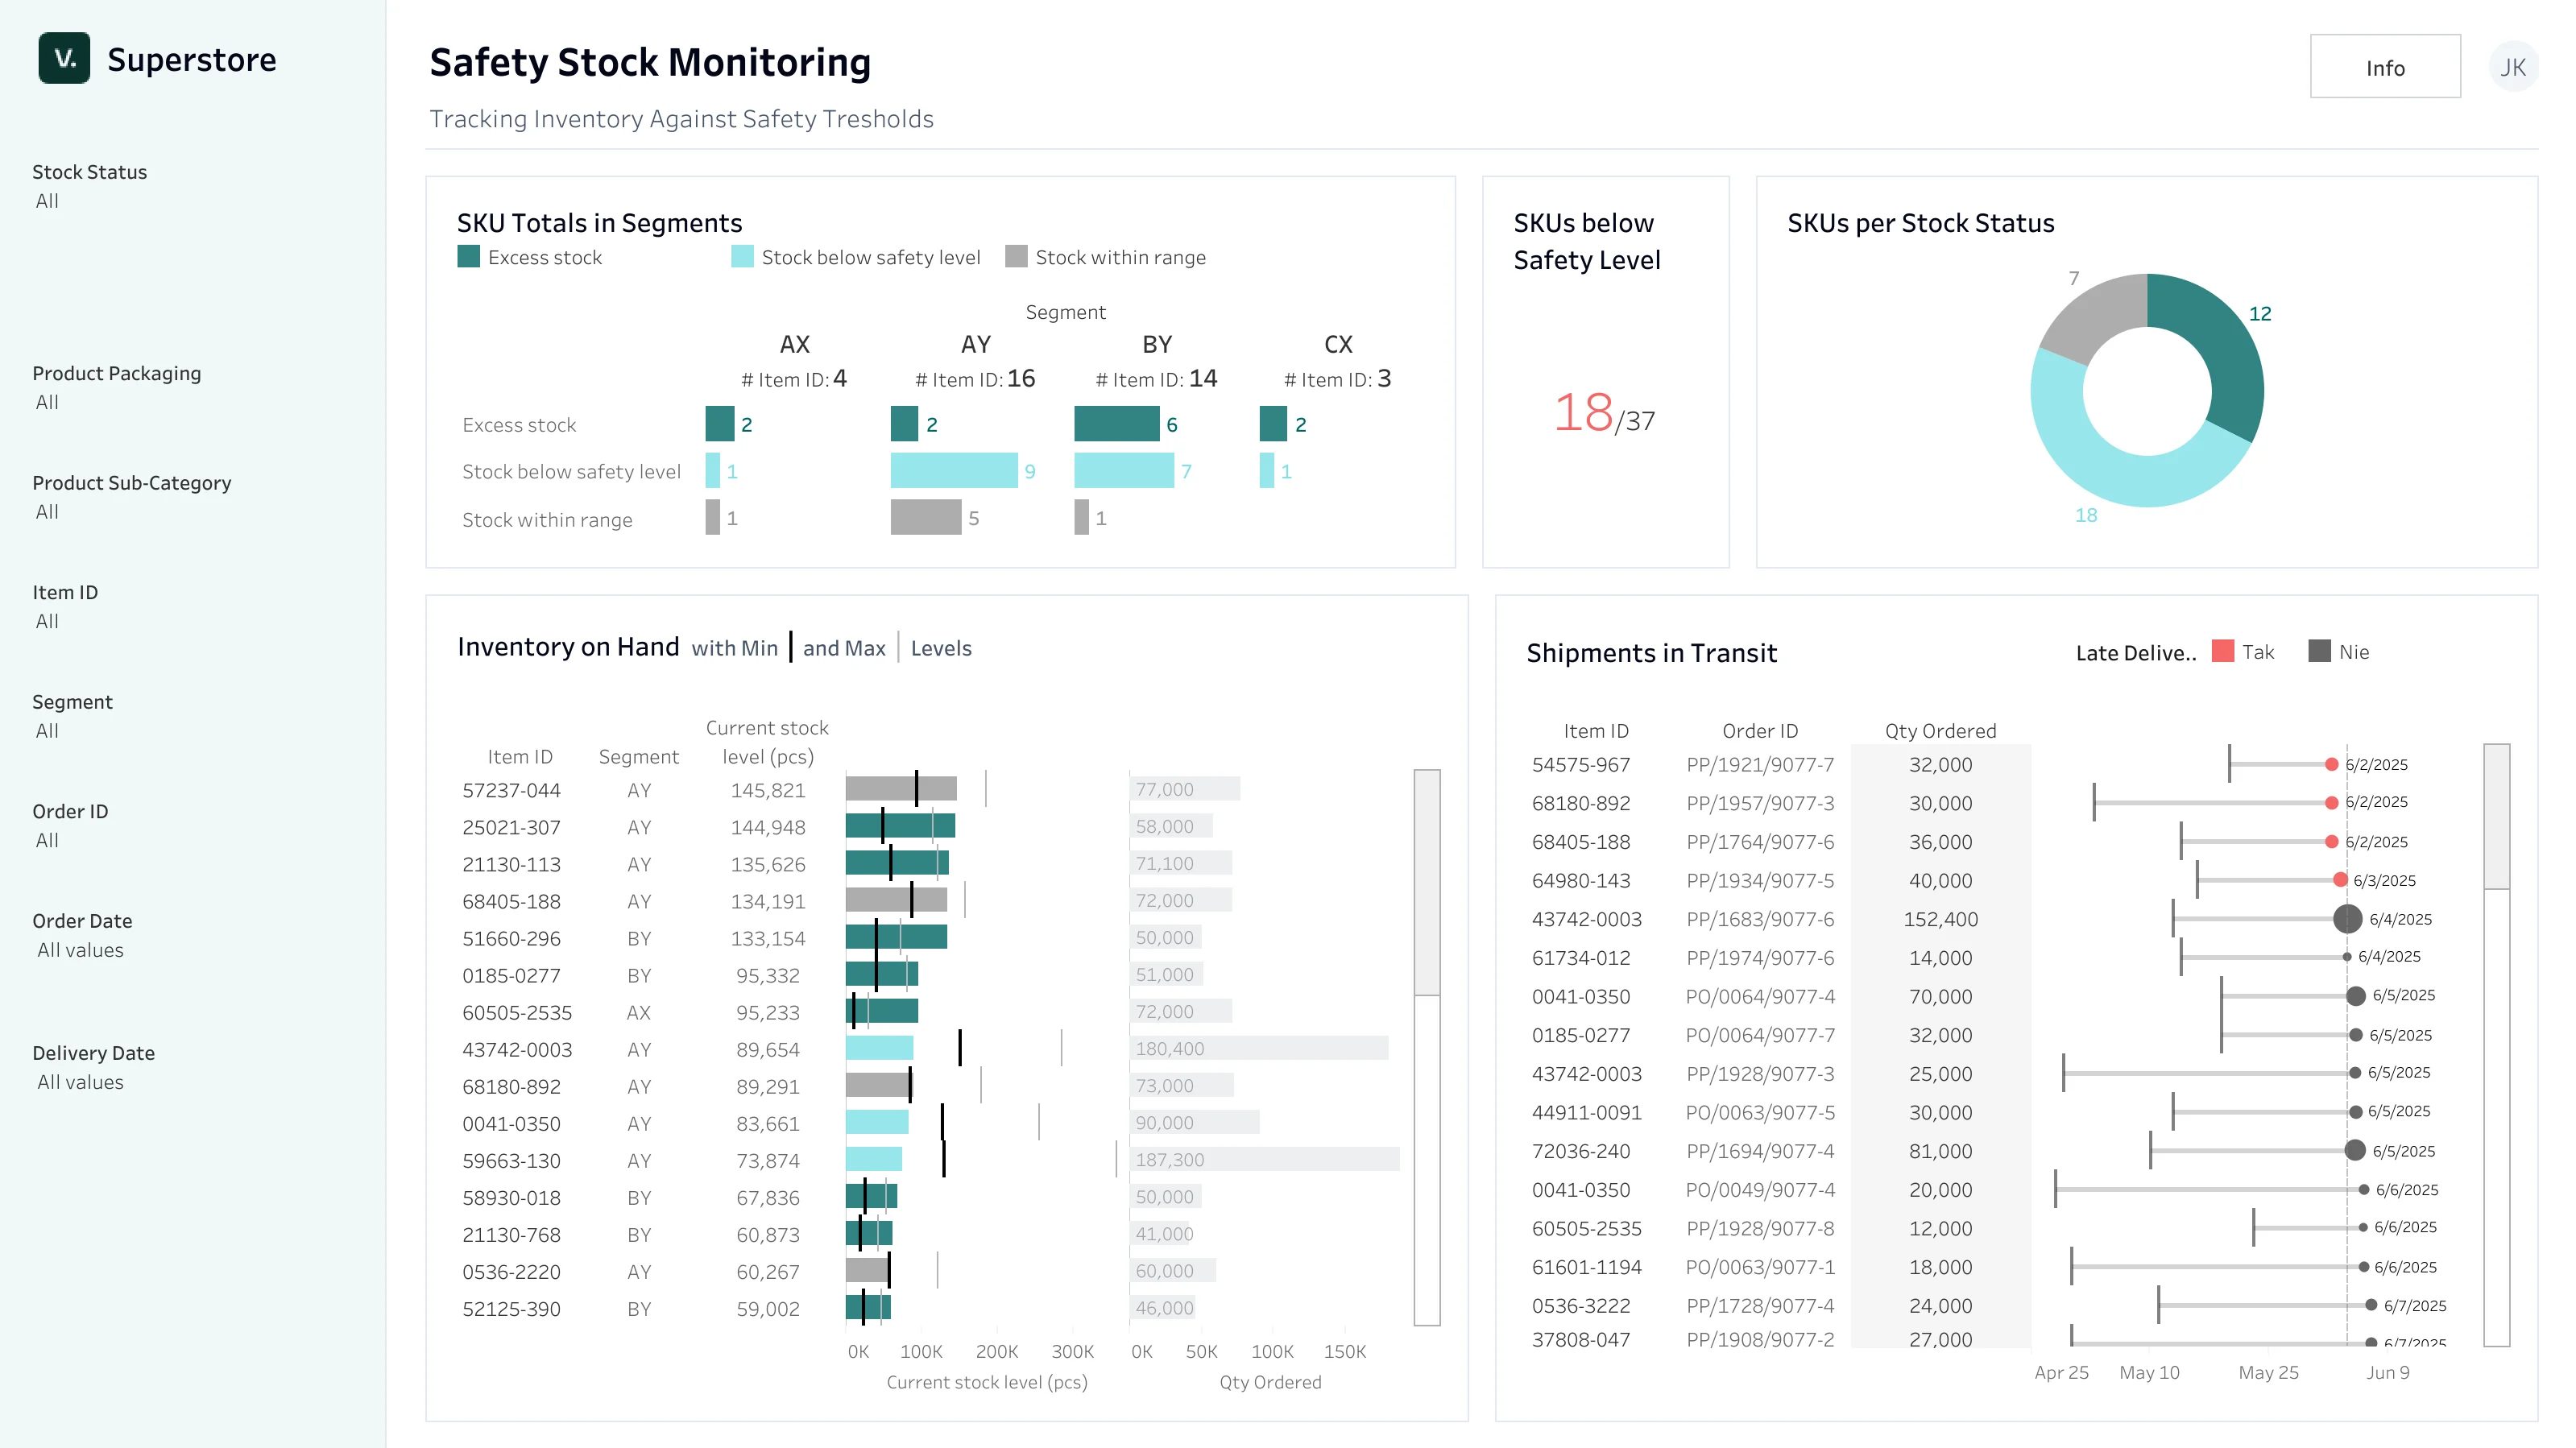
Logistics Dashboard
Dashboard for production

Dashboard for e-commerce
Blog.Learn moreaboutTableau Desktop
